10 Software Testing Best Practices to Ship Better Code in 2026
Discover 10 actionable software testing best practices for 2026. Improve triage, collaboration, and code quality with modern tools and techniques.
10 Software Testing Best Practices to Ship Better Code in 2026
In a fast-paced development cycle, traditional QA can't keep up. The gap between a user reporting a bug and a developer truly understanding it is where productivity disappears. Vague bug reports, endless back-and-forth communication, and unreproducible issues burn valuable engineering hours, leading to slower releases and persistent quality issues. This isn't just a process problem; it's a tooling and strategy problem.
The key to shipping better code faster lies in adopting software testing best practices that create a single source of truth for every issue. This means providing developers with complete context, automating tedious analysis, and fostering seamless collaboration between QA, engineering, and product teams. To truly modernize your QA strategy and ensure faster, more reliable software delivery, understanding the principles of DevOps Quality Assurance is a critical starting point. This framework emphasizes integrating quality checks throughout the entire software lifecycle, not just at the end.
This guide moves beyond generic advice to offer 10 specific, actionable strategies that modern teams can implement today. We will explore how to shorten feedback loops, eliminate ambiguity from bug reports, and build a more resilient testing culture. From capturing complete session recordings to implementing AI-assisted triage, you will learn how to transform your bug resolution workflow from a frustrating guessing game into a clear, efficient, and data-driven process.
1. Capture Complete Reproduction Steps with Session Recording
One of the most persistent bottlenecks in software development is the "cannot reproduce" bug. A vague bug report without context forces developers to spend hours guessing, leading to frustration and delays. This is where session recording emerges as a critical software testing best practice, transforming bug reporting from a guessing game into a precise, data-driven process.
Session recording tools capture the entire user journey leading to a bug, creating a replayable video of the user's screen combined with technical data. This includes every click, scroll, navigation event, console log, and network request. Instead of a text-based description like "the button didn't work," developers receive a complete, verifiable artifact that shows exactly what happened.
Why It's a Game-Changer
This practice directly attacks the root cause of slow bug resolution cycles: incomplete information. By providing a full-fidelity recording, you eliminate the need for lengthy email chains or meetings to clarify reproduction steps. Developers can simply watch the session, inspect the accompanying technical logs at the exact moment the error occurred, and understand the problem's context instantly.
For example, a support team at a SaaS company can use a tool like Monito to record a customer-reported issue, cutting ticket resolution time significantly. Similarly, QA teams can capture elusive bugs in complex, multi-step workflows that are nearly impossible to document accurately with text and static screenshots alone.
Practical Implementation Tips
To maximize the value of session recording in your software testing lifecycle, follow these actionable tips:
- Provide Context: Configure recordings to capture a few seconds of user activity before and after the bug appears. This helps developers understand the user's intent and the immediate aftermath of the error.
- Generate Test Cases: Use the detailed user actions captured in a recording as a blueprint for a new automated test case. This ensures the exact sequence that triggered the bug is covered in your regression suite.
- Integrate with Your Workflow: Share direct links to session recordings in your project management tools like Jira or Linear. This enables asynchronous collaboration and gives developers all the context they need directly within the ticket.
- Analyze User Friction: Review session recordings during sprint planning meetings to gain empathy for user pain points. Watching real users struggle with a feature is a powerful way to prioritize fixes and improvements.
- Tag and Organize: Implement a tagging system for your recordings. Tag sessions by feature area (e.g.,
checkout-flow,user-profile), bug severity, or user journey to easily identify trends and retrieve specific examples later.
2. Implement AI-Assisted Root Cause Analysis and Triage
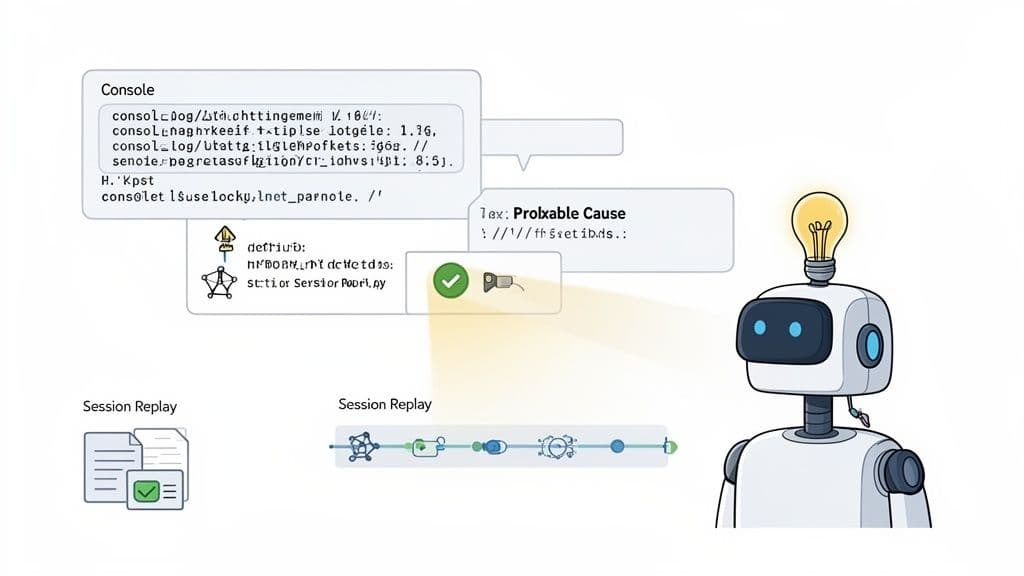
Manually digging through logs and session data to find the root cause of a bug is a slow, resource-intensive process. AI-assisted root cause analysis and triage introduces machine learning to automate this investigation, transforming a critical but tedious part of the software testing lifecycle. This practice moves teams from reactive debugging to proactive, data-driven problem-solving.
AI-powered tools automatically analyze vast datasets, including session replays, console logs, and network activity, to identify patterns and correlations that human eyes might miss. The system then surfaces probable causes and suggests remediation steps, drastically reducing the manual effort required to diagnose an issue.
Why It's a Game-Changer
This approach fundamentally accelerates the Mean Time To Resolution (MTTR) by cutting down the initial investigation phase. Instead of developers spending hours sifting through data, an AI model can instantly pinpoint that checkout failures are correlated with timeouts from a specific third-party payment API. This allows engineering effort to be focused directly on the solution rather than the discovery.
For example, a fintech startup can use AI to flag and automatically escalate critical security-adjacent patterns, like failed authentication loops, to the security team. Similarly, a SaaS company could identify that 80% of "slow load" complaints originate from a single unoptimized database query affecting a specific user segment, prioritizing a fix that has a disproportionately high impact. To effectively implement AI-assisted root cause analysis and triage, exploring the best AI testing tools can provide significant advantages.
Practical Implementation Tips
To integrate AI-driven analysis into your software testing best practices, focus on these actionable steps:
- Train Your Models: Feed historical bug data and successful resolutions into your AI models. This "trains" the system to recognize patterns specific to your application, improving the accuracy of its suggestions over time.
- Validate AI Suggestions: Use AI-generated hypotheses as a powerful starting point, not a final diagnosis. Always have an engineer validate the findings before committing to a solution.
- Refine with Feedback: Regularly review false positives and negatives generated by the AI. Use this feedback loop to refine model parameters and improve its performance for future analyses.
- Create Proactive Alerts: Configure automated alerts for high-confidence, high-impact issues identified by the AI. This enables your team to respond to critical problems proactively, often before users even report them.
- Combine with User Context: Pair AI insights with qualitative user feedback. Understanding the technical root cause is vital, but connecting it to the user's experience helps in prioritizing fixes that truly matter.
3. Establish Clear Bug Report Standards and Structured Ticket Exports
A well-intentioned bug report can quickly become a time sink if it lacks essential information. Ambiguous descriptions like "the login page is broken" leave developers with more questions than answers, creating a cycle of back-and-forth communication that grinds development to a halt. Establishing clear, enforceable bug report standards is a foundational software testing best practice that brings order to chaos.
This involves defining a consistent format that includes every piece of critical information: precise reproduction steps, expected vs. actual behavior, environment details (OS, browser, screen size), and attached evidence. Modern tools can automate this process, allowing support or QA teams to export a structured, pre-filled ticket directly to a system like Jira or Linear, ensuring every bug report is immediately actionable.
Why It's a Game-Changer
Standardization eliminates ambiguity and drastically reduces the time from bug discovery to resolution. When developers receive a ticket that already contains a session replay, console logs, environment data, and a clear description, they can bypass the investigative phase and move directly to debugging. This systematic approach transforms bug triage from a manual, error-prone task into a streamlined, efficient workflow.
For instance, a support team at a high-growth SaaS company can use a tool like Monito to export customer-reported issues directly to Jira. By enforcing a standard template, they can cut the "unclear requirements" back-and-forth by over 70%. Similarly, a QA team for a fintech app can use structured exports to track regression bugs consistently, making it easier to perform root cause analysis across different releases.
Practical Implementation Tips
To effectively implement standardized bug reporting in your software testing lifecycle, follow these actionable tips:
- Review and Refine Templates: Revisit your bug report templates quarterly. Analyze which fields engineers consistently find valuable and remove those that are ignored to keep the process lean. For a deep dive into creating the perfect format, check out this comprehensive bug report template.
- Include Environment Snapshots: Ensure every report automatically captures crucial environment details like OS, browser version, and screen resolution. This is vital for catching version-specific or responsive design issues early.
- Use Severity Levels Consistently: Define and document clear criteria for each severity level. For example, Critical could mean user data loss or a complete service outage, while Minor could be a small UI misalignment.
- Create Specialized Templates: Develop different templates for different issue types. A UI bug requires different information than a performance bottleneck or a security vulnerability.
- Measure Cycle Time: Track the average time it takes for a ticket to move from "To Do" to "Done" before and after implementing standardization. Use this data to validate the process improvement and demonstrate its impact.
4. Implement Early-Stage Regression Testing Through Continuous Session Capture
Traditional regression testing often happens late in the development cycle, making it a costly and time-consuming bottleneck. A modern software testing best practice is to shift this process left by continuously capturing and analyzing user sessions in pre-production environments. This approach identifies regressions as soon as they are introduced, well before code reaches production.
Continuous session capture involves recording baseline user journeys for critical workflows and then comparing subsequent sessions against this established standard. When a new code change causes a deviation, such as a broken button, a visual glitch, or a performance slowdown, the system flags it automatically. This transforms regression testing from a manual, periodic chore into an automated, ongoing safety net.
Why It's a Game-Changer
This practice provides an early warning system for unintended side effects, which are a common source of production bugs. Instead of waiting for a full QA cycle or, worse, for customer complaints, developers receive immediate feedback when their changes break existing functionality. This drastically reduces the cost and effort required to fix regressions.
For example, an e-commerce platform can record a baseline checkout flow. When a developer pushes a change that inadvertently breaks the auto-fill for the country field, the system detects the deviation in the staging environment instantly. Similarly, a mobile app team could use this to catch that a CSS refactor broke button interactions on tablets, allowing them to fix it before thousands of users are impacted.
Practical Implementation Tips
To effectively integrate continuous session capture into your testing strategy, consider these actionable steps:
- Establish CI/CD Gates: Block pull requests or deployments from merging if critical user journeys show significant deviations from their established baselines. This makes regression detection a mandatory part of the development workflow.
- Prioritize High-Impact Workflows: Begin by defining baselines for your most critical user paths, such as authentication, checkout, or core feature interactions. This ensures you protect your most important revenue-generating and user-engaging functionality first.
- Update Baselines Deliberately: After intentionally changing a feature's UI or behavior, proactively update the corresponding baseline recording. This prevents false positives and reduces alert fatigue for your engineering team.
- Inform Code Reviews: Use flagged regressions to guide code reviews. If a change triggers a regression alert, require the author to provide context and justification, ensuring every deviation is intentional and understood.
- Track Escape Metrics: Monitor the number of regressions that make it to production despite this process. Use this "escape rate" as a key performance indicator to continuously refine your baselines and improve detection accuracy.
5. Integrate Network Activity Analysis Into Bug Investigation
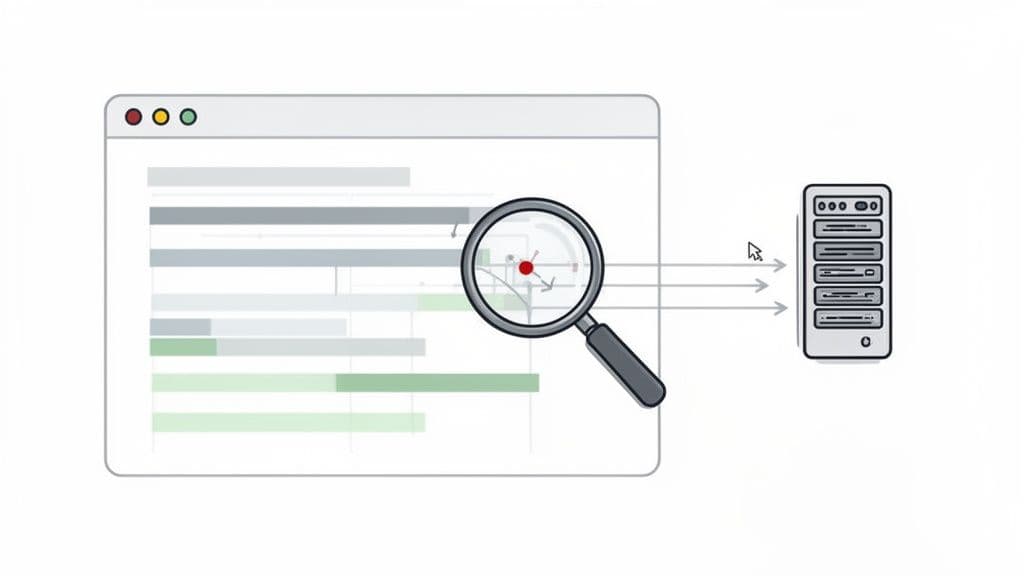
Bugs that seem to originate in the user interface are often symptoms of a deeper problem within the client-server communication layer. A button that "doesn't work" might be a UI issue, or it could be a failed API call, a network timeout, or an unexpected server response. This is why integrating network activity analysis is one of the most impactful software testing best practices for modern web applications.
By capturing and analyzing all HTTP requests, responses, and WebSocket messages alongside user actions, teams can immediately diagnose issues that span both the front end and back end. This practice transforms bug investigation by providing a complete picture of the application's communication, pinpointing the exact source of failure without guesswork or cross-team finger-pointing.
Why It's a Game-Changer
This approach directly bridges the gap between front-end behavior and back-end logic, a common source of friction in debugging. Instead of a QA tester simply reporting a front-end error, they can provide the exact failed network request, complete with its payload and the server's error response. This empowers back-end developers to solve the problem faster and more efficiently.
For example, a payment processing company can identify checkout failures that correlate with a third-party API returning 503 Service Unavailable errors during peak hours, identifying the root cause in minutes. Similarly, a real-time collaboration app can use WebSocket logs to debug a rare race condition where simultaneous edits fail to sync, an issue invisible from the UI alone. By combining user context with network data, you accelerate triage and resolution significantly.
Practical Implementation Tips
To effectively integrate network analysis into your software testing and debugging workflow, consider these actionable strategies:
- Filter for Clarity: Create network activity filters based on your application’s architecture. Isolate requests to your primary API domain, third-party services, and CDN assets to quickly narrow down the source of a problem.
- Establish a Triage Process: Train your QA and support teams to look for slow requests (e.g., over 200ms) and failed requests (4xx, 5xx status codes, timeouts) as the first step in debugging. This simple check can resolve many issues instantly.
- Analyze Request Waterfalls: Use network timing waterfalls to identify bottlenecks. This visualization helps you see if requests are blocking each other in a series when they could be running in parallel. For a deeper dive, you can learn how to open and analyze HAR files to inspect these waterfalls.
- Correlate with User Actions: Match network delays and failures with the user's actions in a session replay. This correlation can reveal issues with client-side waiting logic or loading states that are directly tied to network performance.
- Archive Logs for Analysis: Store and archive network logs from bug reports. Over time, this data becomes an invaluable resource for analyzing performance trends and identifying recurring issues across different software releases.
6. Establish Cross-Functional Collaboration Through Shared Bug Evidence
Silos between support, QA, product, and engineering are a primary cause of friction in the development lifecycle. When each team operates with its own interpretation of an issue, miscommunication and delays become inevitable. A crucial software testing best practice is to establish a single source of truth for bug evidence, enabling seamless, asynchronous collaboration.
By centralizing shared artifacts like session recordings, logs, and screenshots, you ensure every stakeholder views the problem from the same data-driven perspective. This eliminates the "telephone game" where a customer issue is filtered and reinterpreted as it moves from support to product to engineering. Instead, everyone has direct, unfiltered access to what actually happened.
Why It's a Game-Changer
This practice directly dismantles communication barriers and reduces context-switching. A product manager can review customer-reported bugs via session recordings to make informed priority decisions without relying on an engineer's summary. This shared understanding aligns teams, builds empathy, and accelerates the entire debugging and resolution process.
For instance, a startup with a distributed team can use shared session links in their project management tool to collaborate on bugs asynchronously across US, EU, and APAC timezones, significantly reducing decision latency. A support team can share a customer session recording with engineering, giving developers a first-hand look at user friction and improving the prioritization of critical UX issues.
Practical Implementation Tips
To foster a culture of shared evidence and cross-functional alignment, integrate these habits into your workflow:
- Make Evidence the Norm: Create a team rule that bug tickets must include a direct link to session evidence, not just static screenshots or written descriptions. This makes comprehensive context the default.
- Use Timestamps for Precision: Pinpoint exact moments in comments to guide collaborators. For example, add a comment like, "At 2:34 in the session, you can see the API call fails with a 401 error."
- Inform Your Roadmap: Review shared sessions during sprint planning meetings to build a collective understanding of user pain points. This helps inform roadmap priorities and UX enhancements based on real-world evidence.
- Manage Access Securely: Use tools that provide access controls to manage who can view sensitive sessions. This ensures you can collaborate effectively while protecting customer data and privacy.
- Streamline Escalations: When escalating an issue to senior engineers or other stakeholders, share the direct link to the recording. This provides them with all the necessary context instantly, avoiding back-and-forth communication.
7. Implement Browser-Agnostic Testing Coverage With Multi-Browser Session Capture
Assuming your application works perfectly in Chrome because it works on your machine is a dangerous gamble. Browser engines, extensions, and minor implementation differences can cause features to break for a significant portion of your user base. This is why implementing browser-agnostic testing, powered by multi-browser session capture, is one of the most crucial software testing best practices for modern web applications.
This approach involves systematically capturing user sessions across all major supported browsers, not just the primary development environment. By recording interactions in browsers like Chrome, Edge, Brave, and even newer ones like Arc, teams can identify and fix browser-specific bugs that would otherwise slip into production. It ensures that your quality assurance efforts reflect the actual diversity of your users' technology choices.
Why It's a Game-Changer
This practice moves teams from a reactive to a proactive stance on cross-browser compatibility. Instead of waiting for users to report that a feature is broken on their specific browser, QA can identify these discrepancies during the testing cycle. This prevents frustrating user experiences and protects brand reputation.
For example, a fintech app team might use multi-browser session capture to discover that a third-party password manager autofill behaves erratically in Brave but works fine in Chrome, leading to a fix that improves security and usability. Similarly, a SaaS company could identify that an interactive drag-and-drop feature has subtle mouse event timing differences across browsers, allowing them to standardize the behavior before a major launch.
Practical Implementation Tips
To effectively integrate multi-browser session capture into your software testing workflow, consider these strategies:
- Create a Browser Matrix: Analyze your user analytics to identify the top browsers your customers use. Create a prioritized testing matrix and ensure your QA process allocates time to each, focusing on the most popular ones first.
- Test in Incognito Mode: Encourage testers to capture sessions in incognito or private modes. This helps isolate issues caused by browser extensions or cached data, mimicking a clean environment many users will have.
- Automate Screenshot Comparisons: During release testing, use tools to automate screenshot comparisons of key user flows across different browsers. This can quickly flag visual regressions or rendering bugs specific to one browser engine.
- Trend Browser-Specific Issues: Use session metadata to tag and track which browsers generate the most bug reports. A high volume from a particular browser may signal a deeper incompatibility that requires a strategic technical investigation.
- Document Workarounds: When a browser-specific fix is implemented, document the workaround clearly in the code with a reference to the corresponding issue ticket. This context is invaluable for future developers. For browsers outside the Chromium ecosystem, it's also important to have a dedicated strategy; you can learn more about screen recording in Firefox to expand your coverage.
8. Create Reproducible Test Cases From Real User Sessions
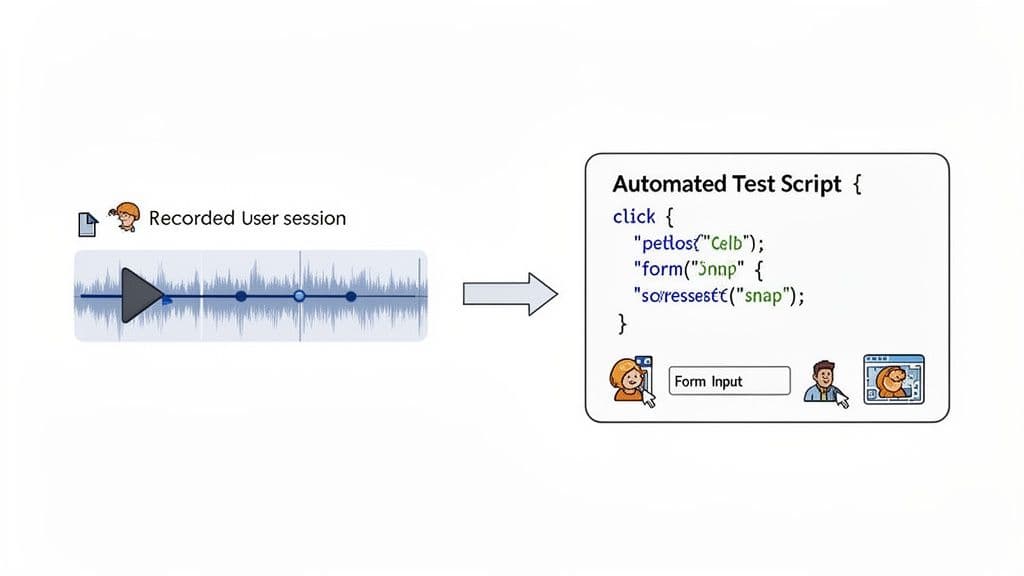
Automated tests are only as valuable as the scenarios they cover. A common pitfall is creating tests based on assumptions about user behavior, which can miss real-world edge cases. This is why one of the most effective software testing best practices is to generate automated test cases directly from captured, real-world user sessions, bridging the gap between how you think users interact with your app and how they actually do.
This approach involves taking a recorded user session that reveals a bug or a critical workflow and using the precise sequence of actions as a blueprint for a new automated test. Instead of manually scripting a synthetic scenario, you are codifying a verified user journey, ensuring your regression suite is grounded in reality. This makes your automated tests more relevant and robust.
Why It's a Game-Changer
This practice directly addresses two major challenges: test relevance and regression prevention. By converting a verified bug report into a test, you guarantee that the specific fix is validated in every future release. This prevents the frustrating re-emergence of old bugs. Furthermore, it enriches your test suite with scenarios that reflect genuine user behavior, increasing confidence in your code deployments.
For example, an e-commerce QA team can convert a customer-reported checkout bug session into an automated Cypress test, ensuring the fix remains effective across releases. Similarly, a SaaS platform can build a regression suite based on the top 20 most-reported user workflows captured in a tool like Monito, systematically reducing post-release bugs and improving user trust.
Practical Implementation Tips
To effectively turn user sessions into automated tests, follow these actionable guidelines:
- Prioritize Critical Paths: Focus on automating sessions that represent high-value user journeys (e.g., sign-up, checkout, core feature usage) or those that have frequently reported issues.
- Create Test Case Templates: Develop standardized templates that map common session steps (clicks, form fills, navigations) to your automation framework's code. This accelerates the conversion process and ensures consistency.
- Version Control Your Tests: Store your automated test case scripts in the same version control system as your application code. This keeps your tests synchronized with the product's evolution.
- Review and Refine: Before writing the code, review the session recording with a developer to confirm a shared understanding of the user's actions and the technical context. This ensures the automated test accurately reflects the real scenario.
- Integrate into CI/CD: Schedule these user-derived tests to run automatically in your CI/CD pipeline. Regularly review failures to catch unintended side effects or new regressions early.
9. Implement Real-Time Performance Monitoring Alongside Feature Testing
Functional bugs are not the only issues that can ruin a user's experience; poor performance is often just as damaging. A common pitfall is treating performance testing as a separate, final step, but the best practice is to integrate it directly into your feature testing process. This means capturing performance metrics like load times, interaction latency, and Core Web Vitals during every user session.
This approach transforms performance from an afterthought into a continuous quality metric. By monitoring performance alongside functional validation, teams can immediately spot regressions caused by new code. This ensures that the speed and responsiveness of your application are never sacrificed for new features, catching critical slowdowns long before they reach production and impact real users.
Why It's a Game-Changer
Integrating performance monitoring with feature testing creates a direct feedback loop between code changes and user-perceived speed. It allows you to answer critical questions in real time: Did this new component increase the Largest Contentful Paint (LCP)? Is a new API call adding unacceptable latency to a key user interaction?
For instance, an e-commerce platform using session data might identify that its checkout flow has a 3-second interaction latency on 4G networks, directly impacting mobile conversion rates. Similarly, a SaaS company could detect that a new feature release increased its dashboard's LCP by 800ms, trace the root cause to unoptimized image assets, and fix it before a full rollout.
Practical Implementation Tips
To effectively merge performance and functional testing, adopt these strategies:
- Define Performance Budgets: Establish clear performance budgets (e.g., LCP under 2.5s, TTI under 5s) for critical pages and features. Enforce these budgets as part of your code review and CI/CD pipeline.
- Track Trends, Not Just Snapshots: Monitor performance metrics over time to identify gradual regressions. A single slow session might be an anomaly, but a consistent upward trend in load times is a clear red flag.
- Correlate with User Behavior: Analyze how performance metrics impact user engagement. For example, use tools like Monito to see if sessions with high interaction latency also have higher bounce rates or shorter durations.
- Test on Realistic Conditions: Ensure your testing accounts for realistic device and network conditions. Avoid testing exclusively on high-end developer machines with fast connections, as this hides real-world performance bottlenecks.
- Inform Roadmap Decisions: Use performance data to prioritize work. Presenting stakeholders with data showing that a 500ms improvement in load time could increase conversions is a powerful way to justify performance-focused sprints.
10. Conduct Incident Retrospectives and Build Quality Metrics Dashboards
Fixing bugs is reactive; preventing them is proactive. To shift from constantly firefighting to building a resilient system, you must treat every incident as a learning opportunity. This is where structured incident retrospectives and data-driven quality dashboards become essential software testing best practices, turning failures into fuel for improvement.
An incident retrospective is a blameless post-mortem that analyzes why a failure occurred, using evidence to identify systemic weaknesses. Paired with a quality dashboard that tracks metrics like Mean Time to Resolution (MTTR), bug escape rates, and severity distribution, teams can move from anecdotal feedback to objective, measurable improvements. This combination provides a powerful feedback loop for your entire development lifecycle.
Why It's a Game-Changer
This dual approach creates a culture of continuous improvement and accountability. Retrospectives foster shared understanding across teams, while dashboards make quality tangible and visible. Instead of letting incidents fade into memory, you create a documented, data-backed process for implementing lasting preventive measures and tracking their impact over time.
For instance, a SaaS company can analyze session recordings from five related payment failures during a retro, discovering the root cause was a lack of API retry logic. A quality dashboard could then track a decrease in payment-related bugs after the fix is implemented. Similarly, an e-commerce platform can use its bug escape rate metric to pause a release if more than a certain threshold of critical bugs make it to production, enforcing a data-driven quality gate.
Practical Implementation Tips
To effectively integrate retrospectives and dashboards into your workflow, consider these strategies:
- Schedule Timely Retros: Conduct retrospectives within two to three days of an incident resolution while the details are still fresh for everyone involved. Invite representatives from support, engineering, and product to get a holistic view.
- Focus on Systems, Not People: Frame the discussion around "what systems failed?" rather than "who made a mistake?" This encourages psychological safety and honest participation. Use session recordings from tools like Monito as the objective source of truth, not fallible human memory.
- Define and Track Clear Metrics: Agree on precise definitions for your key metrics. For example, specify that MTTR starts when a bug report is created and ends when the fix is deployed to production. Review these metrics monthly with leadership to spot trends.
- Create Actionable Outcomes: Every retrospective should produce a list of concrete action items. Track these in a visible backlog and review their completion status at the start of the next retro to ensure accountability and follow-through.
- Correlate with Business Goals: Connect your quality metrics to business outcomes like customer churn or support ticket volume. Showing that a 20% reduction in MTTR led to a 10% drop in support load makes the value of quality initiatives clear to the entire organization.
10-Point Software Testing Best Practices Comparison
| Item | 🔄 Implementation complexity | 💡 Resource requirements | ⭐ Expected outcomes / quality | ⚡ Speed / efficiency | 📊 Ideal use cases |
|---|---|---|---|---|---|
| Capture Complete Reproduction Steps with Session Recording | Moderate — install/ configure extension | Storage-heavy; privacy/consent controls needed | ⭐⭐⭐⭐ Verifiable, full-context repro artifacts | ⚡⚡⚡ Reduces repro clarification cycles | Support/QA for multi-step UI bugs; developer replay |
| Implement AI-Assisted Root Cause Analysis and Triage | High — ML integration and tuning | Historical session data, compute, model maintenance | ⭐⭐⭐ Probable causes and prioritized issues | ⚡⚡⚡⚡ Cuts triage time; surfaces patterns quickly | High-volume tickets; prioritization and anomaly detection |
| Establish Clear Bug Report Standards and Structured Ticket Exports | Low–Moderate — define templates and mappings | Tooling config and team process alignment | ⭐⭐⭐ Consistent, actionable tickets with required fields | ⚡⚡ Faster handoff; fewer clarification loops | Support→Engineering handoffs; standardized reporting |
| Implement Early-Stage Regression Testing Through Continuous Session Capture | Moderate–High — baseline creation and CI gates | Continuous capture storage; baseline maintenance | ⭐⭐⭐⭐ Early detection of unintended regressions | ⚡⚡ Prevents post-release fixes when enforced in CI | Staging testing for critical user journeys |
| Integrate Network Activity Analysis Into Bug Investigation | Moderate — capture/parsing and correlation | Storage for payloads; sensitive-data filtering required | ⭐⭐⭐⭐ Clear client-server failure evidence | ⚡⚡⚡ Speeds backend diagnosis and root cause ID | API failures, third‑party integrations, timing bugs |
| Establish Cross-Functional Collaboration Through Shared Bug Evidence | Low — share links, RBAC and embedding | Access controls; cultural adoption effort | ⭐⭐⭐ Better alignment; shared context across teams | ⚡⚡ Enables async collaboration; fewer meetings | Distributed teams; product/support/engineering sync |
| Implement Browser-Agnostic Testing Coverage With Multi-Browser Session Capture | Low–Moderate — install across browsers, define matrix | Maintain multiple browser environments and matrix | ⭐⭐⭐ Detects browser-specific rendering/behavior issues | ⚡⚡ Prevents late browser-specific regressions | Web apps with diverse Chromium-based browser usage |
| Create Reproducible Test Cases From Real User Sessions | Moderate — convert sessions to automation scripts | QE/dev effort; CI integration and maintenance | ⭐⭐⭐⭐ High-confidence automated tests grounded in real flows | ⚡⚡⚡ Reduces regressions; automates verification | Regression suites for top user workflows; CI tests |
| Implement Real-Time Performance Monitoring Alongside Feature Testing | Moderate — instrument metrics and baselines | Instrumentation, threshold definitions, storage | ⭐⭐⭐ Detects performance regressions early | ⚡⚡ Enables proactive fixes; depends on thresholds | Performance-sensitive pages, mobile/network-constrained users |
| Conduct Incident Retrospectives and Build Quality Metrics Dashboards | Moderate — dashboarding and retro process setup | Cross-team time, analytics tooling, disciplined inputs | ⭐⭐⭐⭐ Systemic improvements, measurable quality trends | ⚡ (long-term ROI) Improves MTTR and process over time | Post-incident learning, leadership reporting, trend analysis |
From Reactive Fixes to Proactive Quality
The journey through modern software testing best practices reveals a fundamental truth: quality is not a final-stage gatekeeper but an ongoing, proactive discipline woven into the fabric of the development lifecycle. Moving beyond traditional, siloed QA processes is no longer an option, it's a necessity for teams aiming to deliver exceptional user experiences at a competitive pace. The ten practices we've explored are not isolated tactics; they are interconnected components of a holistic quality engineering strategy.
The core theme connecting these methods is the shift from reactive bug-fixing to proactive quality assurance. Instead of waiting for a vague ticket to land in a backlog, modern teams are capturing rich, contextual data at the earliest possible moment. This is the essence of practices like implementing continuous session recording for early-stage regression testing and integrating network activity analysis directly into bug investigations. You are no longer just reacting to a user's complaint; you are observing the precise environment, sequence of actions, and technical failures that led to the issue.
Synthesizing the Core Takeaways
To truly transform your approach, focus on these critical pillars derived from our list of software testing best practices:
- Context is King: The single most significant bottleneck in any testing workflow is the lack of complete, reproducible context. Practices like capturing full session replays, console logs, and network requests eliminate the endless back-and-forth between QA, support, and engineering. This turns ambiguous bug reports into definitive, actionable evidence.
- Collaboration Over Handoffs: Quality is a team sport. Establishing clear bug report standards, creating reproducible test cases from real user sessions, and sharing unified bug evidence fosters a culture of shared ownership. When a developer can see exactly what a support agent or user experienced, the focus shifts from debating the problem to solving it collaboratively.
- Automation and AI as Accelerators: Manual effort should be reserved for high-value, exploratory testing, not for repetitive data gathering or initial analysis. By leveraging AI-assisted root cause analysis and automating the creation of structured ticket exports, you free up your most valuable resource, your team's cognitive energy, to focus on complex problem-solving and feature innovation.
Actionable Next Steps: Building Your Quality Flywheel
Adopting these software testing best practices is a marathon, not a sprint. The key is to build momentum through small, incremental improvements that create a positive feedback loop, or a "quality flywheel."
- Start with Triage: The biggest immediate impact often comes from fixing the bug reporting and triage process. Implement a tool that automatically captures session recordings and technical metadata. This single step will drastically reduce the time spent on reproducing and diagnosing bugs.
- Standardize Your Reporting: Once you have better data, formalize it. Use the insights from your new tooling to establish clear, structured bug report standards. Ensure every ticket exported to your project management system contains a link to a session replay, console logs, and network details.
- Expand and Integrate: With a solid foundation in triage and reporting, begin integrating these practices earlier into your lifecycle. Use session recordings for early-stage regression testing in staging environments and connect performance monitoring with your functional testing efforts to gain a more complete picture of application health.
Ultimately, mastering these software testing best practices is about building a more resilient, efficient, and user-centric development organization. It’s about empowering every team member, from customer support to the lead engineer, with the information they need to contribute to product quality. By embracing a culture of transparency, evidence, and continuous improvement, you move beyond simply shipping features and begin delivering consistently reliable and delightful software.
Ready to transform your bug reporting workflow from a bottleneck into an accelerator? Monito automatically captures the complete technical context behind every bug, including session replays, console logs, and network requests, so your team can diagnose and fix issues up to 70% faster. See how integrating modern software testing best practices is easier than you think by trying Monito today.