A Guide to Taking the Perfect Screenshot for Safari
Learn how to take any screenshot for Safari on macOS and iOS. Our guide covers everything from simple shortcuts to developer tools for bug reporting.
A Guide to Taking the Perfect Screenshot for Safari
Knowing how to take a screenshot in Safari seems basic, but it’s a skill that can dramatically change how you communicate. It’s not just about capturing an image; it’s about sharing precise visual information that gets things done.
If you're a developer hunting down a UI bug, a designer giving feedback, or a QA tester logging an issue, a good screenshot is your best friend.
Why Getting Good at Safari Screenshots is a Big Deal
Let's be honest, a picture is worth a thousand words—especially in web development. A clean, well-annotated screenshot can be the difference between a bug getting fixed in ten minutes versus a week of back-and-forth emails. It replaces vague descriptions like "the button looks weird" with undeniable proof.
This is especially critical when you remember just how many people use Safari. You simply can't ignore it. In the US, Safari is the undisputed king of mobile browsers, holding a massive 55.21% market share. That's more than half of all browsing on iPhones and iPads, leaving Chrome's 37.98% far behind. If your site or app has an American audience, it has to work perfectly in Safari.
Making Work Faster and Clearer
A perfect Safari screenshot does a few really important things that help your team move faster:
- Ends the Guesswork: It shows exactly what’s happening on the screen, so there’s no room for misinterpretation between team members.
- Supercharges Debugging: When you pair a screenshot with console logs or network details, you give developers the context they need to find the root of the problem right away.
- Builds Better Documentation: Screenshots are the backbone of great support articles, training materials, and internal knowledge bases.
This skill isn't just for bug reports. It's the first step toward building more detailed instructions. For instance, it's a foundational skill you'll need when you want to create a step-by-step guide for new team members or customers.
A great screenshot doesn’t just show a problem; it starts a conversation. It’s the anchor point for collaboration between developers, designers, and project managers, ensuring everyone is looking at the exact same thing.
In this guide, we’ll walk through all the ways to grab the perfect screenshot in Safari. We'll start with the simple OS shortcuts and move all the way to advanced developer techniques, so you can capture exactly what you need, every single time.
Your Go-To Native Screenshot Methods
Before we get into the heavy-duty developer tools or third-party apps, it’s worth mastering the essentials right on your Mac or iPhone. Apple’s built-in tools for taking a screenshot for Safari are incredibly fast, reliable, and honestly, they’re often all you need for a quick bug report or sharing a design tweak with your team.
Getting this right is more than just a convenience. A clear, well-contextualized screenshot is the ground truth for your team, cutting through ambiguity and accelerating everything from debugging to design sign-offs.

As you can see, whether you're filing a detailed ticket or just collaborating on a new feature, that single image saves a ton of back-and-forth.
For a quick overview, this table breaks down the most common native screenshot methods you'll use across Apple devices.
Safari Screenshot Shortcuts for macOS and iOS
| Action | macOS Shortcut | iOS/iPadOS Action | Best For |
|---|---|---|---|
| Capture Selected Area | Shift + Command + 4 | N/A | Isolating a specific UI element or bug on a webpage. |
| Capture a Window | Shift + Command + 4, then Spacebar | N/A | Getting a clean shot of the entire Safari window, including the URL bar. |
| Full Page Capture | N/A | Standard screenshot, tap thumbnail, then select 'Full Page'. | Capturing an entire webpage from top to bottom as a single PDF. |
| Advanced Options / Timed Capture | Shift + Command + 5 | N/A | Capturing hover states, dropdowns, or for screen recording. |
These built-in shortcuts are your first line of defense and will cover the vast majority of your day-to-day needs without ever leaving the OS.
Capturing Screenshots on macOS
On a Mac, you have a few core shortcuts that are like specialized tools in your kit. Knowing which one to grab saves a lot of fumbling. My personal go-to is Shift + Command + 4, which turns your cursor into a set of crosshairs. It’s perfect for zeroing in on a specific bug on a webpage without capturing all the clutter of my desktop.
Here's a subtle but powerful twist on that shortcut: for capturing a specific Safari window, press Shift + Command + 4, but then tap the Spacebar. Your cursor will change to a camera icon. Now you can just click on the Safari window to capture it perfectly, complete with a clean drop shadow. This is my preferred method for showing the entire browser context, including the URL bar and any open tabs.
If you need even more control, macOS has a dedicated Screenshot utility.
- Bring it up: Just press Shift + Command + 5 to open a small control panel at the bottom of your screen.
- Find your options: From here, you can grab the entire screen, a window, or a selected portion. You can also record your screen.
- Use the timer: This is the killer feature. You can set a timer to capture dropdown menus or hover states that vanish the moment you click away.
Pro Tip: Using the built-in timer (
Shift+Command+5) is a game-changer for documenting those pesky, disappearing UI elements in Safari. It’s hands-down the easiest way to prove those tricky hover-state bugs actually exist.
The Hidden Gem for iOS and iPadOS
On an iPhone or iPad, everyone knows the standard screenshot shortcut (pressing the side/top button and volume up button together). It works great for whatever is visible on the screen. But there’s a feature tucked away that many people miss, and it’s a lifesaver for web development and QA.
After you take a screenshot, immediately tap the little thumbnail that pops up in the corner. You’ll land on an editing screen with two tabs at the top: 'Screen' and 'Full Page'.
Tapping 'Full Page' instantly converts your screenshot into a scrollable PDF of the entire webpage, from the navigation bar all the way down to the footer. This is the perfect native solution for capturing long landing pages or user flows in Safari without having to stitch a bunch of images together. You get a clean, shareable document that preserves the complete context for review.
Capturing Full Web Pages for Complete Context
A screenshot of what’s visible on your screen is fine, but it rarely tells the whole story. When you're trying to document a long landing page, review a complex design, or file a bug report that involves elements "below the fold," you need a full-page screenshot for Safari to give everyone the complete picture.
The most obvious method is hiding in plain sight: Safari’s built-in "Export as PDF" feature. Just head to the menu bar and select File > Export as PDF. This will give you a clean, vector-based document of the entire webpage. The catch? It's not always a perfect mirror of the live site. PDFs can sometimes get tripped up by complex layouts, interactive components, or custom web fonts, leaving you with a file that looks a bit... off.
For a more reliable, developer-friendly capture, we need to pop the hood and use Safari’s own Developer Tools.
Unlocking Developer Tools for High-Fidelity Captures
This might sound a bit technical, but I promise it's dead simple and delivers a pixel-perfect image of the entire page. It’s my go-to technique because it captures the page exactly as the browser renders it, sidestepping all the weirdness that can happen with PDF exports or third-party extensions.
First things first, you need to enable the Develop menu if you haven't already.
- Open Safari's Settings (you might see it as Preferences on older macOS versions).
- Click on the Advanced tab.
- At the very bottom, tick the box for "Show features for web developers" (or "Show Develop menu in menu bar").
That’s it. You'll now see a new "Develop" item in your Safari menu bar, right between "Bookmarks" and "Window." This opens up a whole world of powerful tools. It's a real testament to how far the browser has come since its debut on January 7, 2003. Today, Safari is used by over 1 billion people worldwide, and its robust developer features are a big reason why. You can dig into its impressive market share growth over at Backlinko.
Taking the Perfect Full-Page Screenshot
With the Develop menu ready to go, grabbing that full-page capture is just a couple of clicks away.
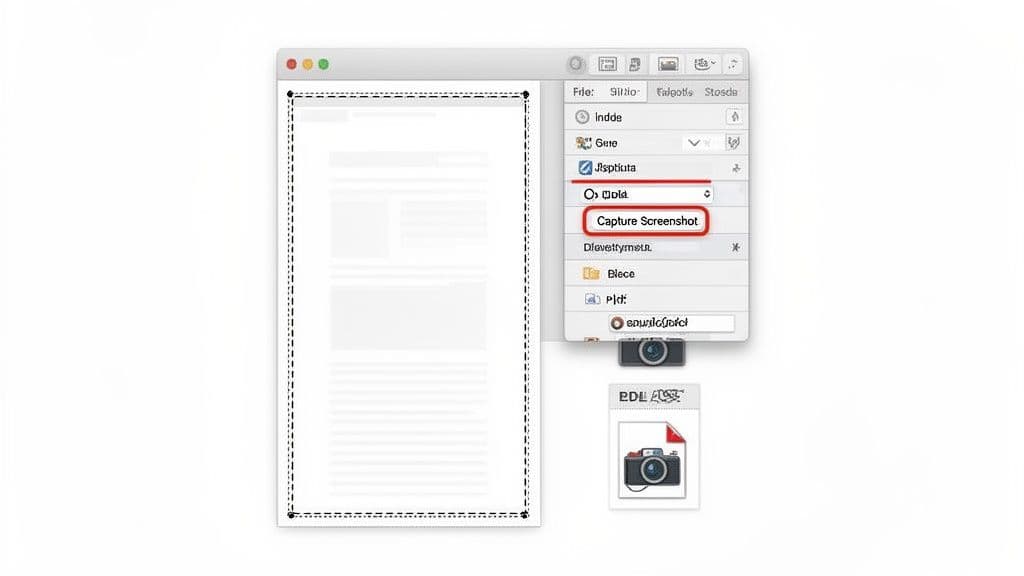
Head over to the webpage you want to save. Now, right-click (or Control-click) anywhere on the page and choose "Inspect Element" from the menu that pops up. This opens the Web Inspector, which is the developer's view into the page's underlying code.
Don't worry, you don't need to understand any of the HTML you see. Just look for the very first line in the Inspector pane, which should start with <html>. That one tag represents the entire webpage document.
Simply right-click on that
<html>tag. Another context menu will appear, and near the bottom, you'll see the magic option: Capture Screenshot.
Click it, and Safari will ask where you want to save a high-resolution PNG image of the entire webpage, from the header all the way down to the footer. This method is incredibly reliable, especially for pages with lazy-loading images or dynamic content, because it captures the page after everything has been fully rendered. The result is a crisp, accurate snapshot of the user experience—perfect for any bug report or design review.
Let's be honest: taking screenshots by hand is a massive time-sink, especially for developers and QA teams. It just doesn't work when you're trying to run hundreds of tests or keep an eye on visual changes across your site. This is where automation comes in, and for Safari, the tool you need to know is safaridriver.
safaridriver is Apple's own implementation of the WebDriver protocol. Think of it as a remote control for Safari that you can operate with code. It opens up a whole new world for automated testing, letting you write scripts that navigate to pages, click on buttons, and—most importantly—snap a screenshot for Safari at any given moment.
This approach is an absolute game-changer for visual regression testing, where you're automatically comparing new screenshots to old ones to catch UI bugs you might have missed.
Getting Started with Safaridriver and Selenium
To get safaridriver working, you’ll usually pair it with a battle-tested automation library like Selenium. First things first, you need to switch it on. Just open Terminal on your Mac and run the command safaridriver --enable. It's a one-time setup that gives your scripts secure permission to talk to the browser.
Apple has some solid documentation on getting WebDriver up and running for testing.
Bookmark that page. It’s the official source and your best friend for figuring out the technical details.
Once you've enabled it, you can start scripting. Here’s a quick and dirty Python example using Selenium that pops open a webpage and saves a screenshot:
from selenium import webdriver
Fire up the Safari driver
driver = webdriver.Safari()
try: # Go to the page you want to capture driver.get("https://example.com")
finally: # Always clean up and close the browser driver.quit()
This simple script does the work of an otherwise tedious manual task. Imagine plugging something like this into your CI/CD pipeline with a tool like Jenkins or GitHub Actions. You could automatically generate screenshots with every single deployment, creating a powerful safety net that catches visual bugs before they ever reach your users.
When you automate your visual testing, you move from putting out fires to preventing them in the first place. Your pipeline flags a broken layout automatically, saving you tons of time and protecting your user experience.
Of course, automated screenshots are just one piece of the puzzle. If you want to get even more technical data for debugging, it's worth learning how to generate a HAR file for network analysis. It's another crucial skill for any serious developer.
Creating Better Bug Reports with Context
A simple image shows you what went wrong, but a truly useful screenshot for Safari shows you why. If you want to get bugs fixed faster, you need to go beyond basic screen captures. The key is to pair the visual evidence with the technical context engineers desperately need. This simple shift transforms a frustrating bug report into a clear, actionable ticket.
The ultimate goal here is to kill the dreaded "works on my machine" response from a developer. By giving them a complete picture of what was happening behind the scenes when the bug occurred, you make the issue reproducible. This is especially critical for Safari, which often renders and behaves differently from its Chromium-based cousins.
Honestly, it's about respecting the developer's time. A report packed with comprehensive data lets them dive right into solving the problem instead of wasting hours just trying to recreate it.
Pairing Visuals with Technical Data
First things first: get comfortable with Safari's Developer Tools. The next time you spot a visual glitch, don't just snap a picture of the broken UI. Instead, open the Web Inspector (just right-click anywhere on the page and select "Inspect Element") and capture what’s happening in two crucial tabs.
- The Console Tab: This is ground zero for JavaScript errors, warnings, and log messages. A screenshot that includes angry red error text in the console is gold—it points developers directly to the faulty code.
- The Network Tab: This tab gives you a play-by-play of all the resources the page is trying to load. If an image is missing or some data never shows up, the network tab will often reveal a failed request, offering an immediate clue.
Including these details tells a much richer story. Your bug report goes from "this button is broken" to "this button is broken, and it's throwing a TypeError every time I click it."
Capturing the console and network activity alongside a visual bug is the single most effective way to cut down debugging time. It provides the "before" and "during" context that a static image alone can never offer.
This level of detail is non-negotiable for anyone building for a wide audience. As of February 2025, Safari commands a huge 17.62% of the global internet browser market, making it the second most popular browser worldwide. That user base is far too large to ignore, so squashing Safari-specific bugs efficiently is just good business. You can find more browser market share stats on mycodelesswebsite.com.
A Smarter Workflow with Dedicated Tools
Let's be real—manually capturing all this information for every bug can be a drag. This is where dedicated bug reporting tools like Monito can completely change your workflow.
Imagine you're clicking through a complex user flow and stumble upon a bug. Instead of juggling multiple screenshots and trying to remember every single step you took, a tool can automatically record your actions in the background. When the bug finally appears, you just hit a button.
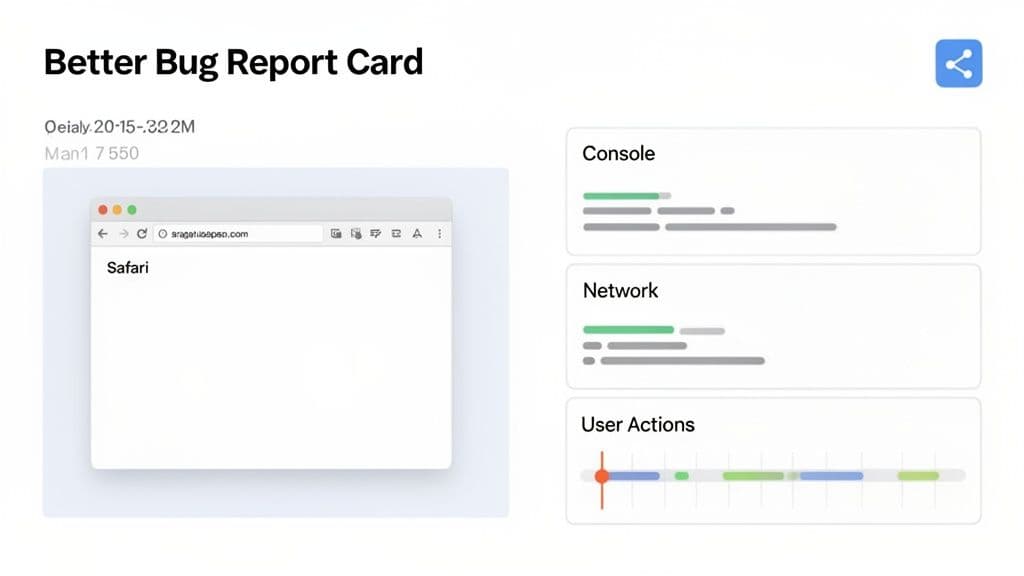
The tool then packages everything into a single, perfect report:
- The screenshot showing the visual error.
- A step-by-step log of your actions (e.g., "Clicked button
#submit"). - All the console logs and network requests leading up to that exact moment.
This process creates a perfectly reproducible bug report that a developer can act on immediately. It cuts out all the frustrating back-and-forth and helps your team resolve Safari-specific issues faster than ever. For more ideas on what makes a great report, check out our guide on creating an effective bug report template.
Troubleshooting Common Safari Screenshot Issues
Taking a screenshot in Safari should be simple, but reality often throws a wrench in the works. Maybe your images come out blurry, or you can't seem to grab that dropdown menu before it vanishes. Worse, those full-page captures sometimes decide to just... stop halfway down the page. It’s frustrating, but don't worry—these are common bumps in the road, and most have straightforward fixes.
One of the biggest headaches I see is blurry or low-res screenshots, especially on Macs with Retina displays. This usually happens because of display scaling. Your Mac is trying to be helpful by scaling the UI to make text readable, but the screenshot tool captures that scaled-down version, leaving you with a fuzzy result. A quick trip to System Settings > Displays on your Mac can usually confirm if a non-native resolution is the cause.
Nailing Crystal-Clear Captures and Tricky Interactive Elements
If you're fighting the blur, my go-to move is to use Safari’s own Developer Tools. When you right-click an element and select "Capture Screenshot," it generates the image directly from the page's Document Object Model (DOM) instead of just snapping a picture of your screen's pixels. The difference in clarity can be night and day.
This same trick is a lifesaver for capturing those "now you see me, now you don't" elements like tooltips or hover-activated menus.
Here’s how you can freeze those hover states in place:
- First, right-click the element and pick Inspect Element.
- This opens the Web Inspector. Hunt down the element's HTML code in the panel.
- Now, right-click that line of code and navigate to Force State > :hover.
Voilà! The element is now locked in its hover state, letting you grab a perfect screenshot with any standard shortcut. It gives you precise control over what you're documenting. If you want to get more comfortable with these tools, our guide on the Safari browser console is a great place to start.
Does File Format Really Matter? (Yes, It Does)
The format you save your screenshot in can make a huge difference. macOS defaults to PNG, which is often the right call, but knowing why will help you make the best choice every time.
When you're filing a bug report, clarity is king. A high-quality PNG is almost always your best bet for UI screenshots. It keeps text and sharp lines perfectly crisp without any compression funkiness, so the engineering team sees exactly what you saw.
Here’s a quick cheat sheet:
- PNG: The champion for UI elements, logos, and anything with text. It uses lossless compression, meaning zero quality is lost, though file sizes can be a bit larger.
- JPG: A better fit for photos or complex images with lots of gradients. Its lossy compression shrinks file sizes but can make text and sharp lines look smudgy. Only use it if file size is your top priority.
- PDF: The perfect choice for full-page captures, especially from an iPhone or iPad. It creates a scalable vector document that’s easy to share and annotate.
For some broader advice on visual troubleshooting, the Screenshot Help Documentation is a solid resource covering a ton of common capture problems.
Got Questions About Safari Screenshots? We’ve Got Answers.
Even after you've mastered the basics, taking screenshots in Safari can throw a few curveballs. Here are a few of the most common questions we hear from folks in the trenches—devs, designers, and QA testers who live and breathe Apple's browser. These are the tricky situations that standard shortcuts don't always handle.
How Can I Capture Just One Specific Element on a Page?
The cleanest way to do this is by diving into Safari's Developer Tools. Just right-click the exact element you want—like a button, an image, or a specific div—and hit "Inspect Element."
This will pop open the Inspector and highlight that element's code. From there, right-click the highlighted code and choose "Capture Screenshot." Safari will save a perfectly cropped PNG of just that element. It's fantastic for giving targeted design feedback or isolating a single broken component for a bug report.
Why Does My Full-Page Screenshot Look Glitchy or Broken?
This is a classic problem, especially on modern websites. The culprit is usually "lazy-loading" images or fixed elements like sticky headers and footers. When the capture tool scrolls down the page, it can outpace the content loading, resulting in blank spots. Or, that sticky header might get stamped over and over again, creating a mess.
I find that using the Developer Tools to capture the full page is way more reliable. It tends to render the entire page's Document Object Model (DOM) in one go, avoiding those scrolling issues. If you're still seeing problems, try a simple trick: manually scroll all the way to the bottom of the page and back up before you take the screenshot. This forces all the lazy-loaded assets to actually load.
Is There a Way to Quickly Edit a Screenshot on my Mac?
Absolutely, and it’s a game-changer for productivity. On recent versions of macOS, whenever you snap a screenshot, a little thumbnail preview slides into the bottom-right corner of your screen.
Don't let it disappear! Click that thumbnail, and it'll open right up in Markup. You can instantly crop it, draw arrows, add text, or highlight a problem area before you even save the file. This is my go-to workflow for creating quick, annotated bug reports without ever having to open a separate image editor.
Ready to stop wasting time on manual bug reporting? Monito captures the full context behind every issue—including user actions, console logs, and network requests—so your team can fix bugs faster. Get started for free at Monito.